| # Install on Terminal of MacOS #pip3 install -U scikit-learn #pip3 install -U matplotlib #pip3 install -U numpy #pip3 install -U pandas #pip3 install -U seaborn |
1_MacOS_Terminal.txt
| ########## Run Terminal on MacOS and execute ### TO UPDATE cd "YOUR_WORKING_DIRECTORY" python3 mlgstcreg.py l2 1 #python3 mlgstcreg.py l2 10 #python3 mlgstcreg.py l2 100 #python3 mlgstcreg.py l2 1000 |
Data files
X.csv
| 4.494746752403546,2.565907751154284 3.3841445311320393,5.169101554140335 4.641125838188323,0.617920368071555 3.3436279255182804,1.7859485832624662 1.854026499900972,2.580673970131322 2.203708371908368,4.056653316946923 3.076269872380446,2.172074458526128 2.6277174035873467,2.471886759188408 4.11294688851731,1.7098624009494876 2.4427445896156783,0.7921262219144254 -1.6104728221529445,2.9243562822910114 3.2224973962333587,0.9504201626223048 5.20991777250232,-0.05678366166746862 2.064712315761789,1.7352820606362547 4.167677153069308,4.077987100384831 2.2191287508753765,2.5348025640025753 0.7444813552199567,-0.8012692296630051 1.5079779199085814,2.2211108325699005 3.7398937663463703,3.7004218892750256 1.4522371617508665,1.5724793501936696 0.5171221759355953,-0.008208625571572536 -0.4130304446548192,4.758813021080532 1.279242972473774,1.3804693813343385 0.2282798109393096,3.0995374058317706 -0.28239622430120104,1.6991398104583528 0.7336190445083068,2.5471627597885957 1.2776124467202452,0.33033395303991564 1.960144310465579,2.6057527405007535 2.094069558025663,2.427759860020327 1.1029330922034843,1.4870065234299592 1.0489973145957656,1.4915150425552421 0.8500374997394751,-0.4413322687061778 2.2509184566947953,1.4317959509113165 -0.30544861163758075,2.654472942190161 0.7168863479702925,2.073461883237738 3.0310897612296968,2.1824093817074885 3.6113559010583245,0.2536925776873813 2.568997005660739,1.0315322817422565 0.7685068615511554,1.181382953515044 1.5593981836737902,2.079429788716632 0.35222929296732475,3.2739610351955215 2.65854613775456,-0.172576656243288 4.104706436697249,4.681192185498803 3.6670460565823193,1.745547856986421 0.4857271207132452,3.491219933093745 1.4298216935543513,3.728798397790962 2.294545298699255,3.3811761709382586 2.503978192058076,2.999245357265979 2.0148492717085826,4.52560227312357 2.1794808027306107,2.5684988097132244 9.26171268561018,4.665612829739954 3.7994554323686414,8.679044351219694 3.9680906587940683,10.366450644211836 5.283590910349264,5.705370290222793 9.330633289873484,9.564326840121662 9.234707005589334,8.569315382059349 4.508313356701943,10.308329544524192 5.53580454491248,8.389895248377957 7.640688535753728,6.731514643080693 7.063616669319316,8.597308810232208 6.6519881452276515,5.095781972826784 6.5165636704814665,9.29736776350474 4.7969731776409015,6.74082537358526 5.246291939324073,10.203018734320477 7.1644486768077105,7.705744602514913 4.66646624149673,7.934006997257856 4.8320215705383225,7.0551321441644586 4.898682286454355,8.171616834778561 6.998684589554707,6.639215972185542 6.685903746468299,5.106761931080872 3.4170660822610364,7.761048751014304 6.288686962260316,8.099906713100598 10.12772783185664,8.635886458173985 4.4189455272526255,8.934728963864012 3.7207815069376498,6.200512012469322 5.881802072387676,9.967596644675044 4.710046809030184,5.568566461709612 5.829475225561735,5.850821898302097 7.9513906587206815,5.129503758820057 4.012525993931379,6.241673437930561 5.137382491582886,10.342047552043745 7.644445075358459,7.151643198344877 3.8774834199866217,8.46247957515756 4.267576199811119,4.324377974317278 8.05772796125969,7.548960706937425 7.594974269386494,7.552052488674493 7.484074153295792,5.872390595376473 4.2086388506648875,8.180556335824212 4.608453642359058,5.805664750588825 5.210994559408913,7.030274791504974 5.386864560138938,4.618514501867448 4.885220225607101,3.1489527746384947 7.082932639669101,4.22515474383443 4.087151945077339,7.090352567660865 4.719039314852367,9.672579676064801 3.760706145442498,7.462545673918223 5.931960162965485,4.976802713921405 6.906341762455969,6.702873038471027 7.336780447503662,8.426351034909207 9.746834572913645,9.314934314159679 |
| 0.0 0.0 0.0 0.0 0.0 0.0 0.0 0.0 0.0 0.0 0.0 0.0 0.0 0.0 0.0 0.0 0.0 0.0 0.0 0.0 0.0 0.0 0.0 0.0 0.0 0.0 0.0 0.0 0.0 0.0 0.0 0.0 0.0 0.0 0.0 0.0 0.0 0.0 0.0 0.0 0.0 0.0 0.0 0.0 0.0 0.0 0.0 0.0 0.0 0.0 1.0 1.0 1.0 1.0 1.0 1.0 1.0 1.0 1.0 1.0 1.0 1.0 1.0 1.0 1.0 1.0 1.0 1.0 1.0 1.0 1.0 1.0 1.0 1.0 1.0 1.0 1.0 1.0 1.0 1.0 1.0 1.0 1.0 1.0 1.0 1.0 1.0 1.0 1.0 1.0 1.0 1.0 1.0 1.0 1.0 1.0 1.0 1.0 1.0 1.0 |
Python files
mlgstcreg.py
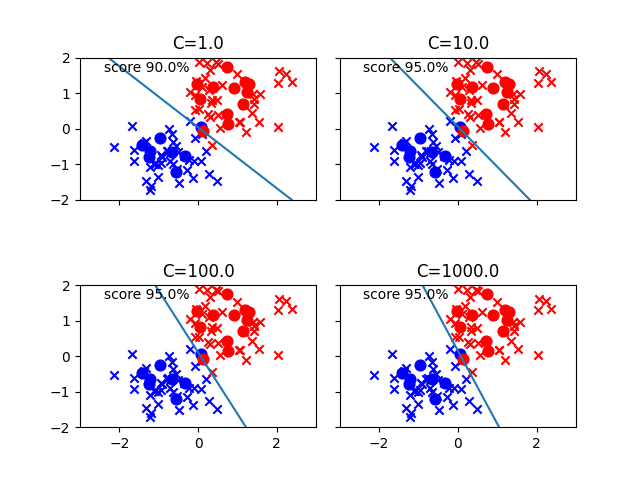
| #################### Multinomial Logistic Regression with L2 (or L1) Regularitation of Standardized Training Data (plus Test Data) in Python #################### # #Run this script on Terminal of MacOS as follows: #python3 mlgstcreg.py l2 1 ##python3 mlgstcreg.py (penalty/regularization of LogisticRegression()) (parameter c, 1 by default) # #Reference #http://ailaby.com/logistic_reg/ ##########Overview ''' We have to avoid overfitting, i.e., letting a model learn outliers and noises of training data too well. Reasons of overfitting are (1) variables are too many, (2) parameters are too big/impactful, and/or (3) data is not enough. We can use L1 regularization (e.g., linear Lasso Regression) to eliminate redundant / unnecessary parameters as in (1). Also, L2 regularization (e.g., linear Ridge Regression) is to avoid (2). ''' ########## import ''' from sklearn import datasets import matplotlib.pyplot as plt import seaborn as sns ''' #from sklearn.cross_validation import train_test_split from sklearn.model_selection import train_test_split from sklearn.preprocessing import StandardScaler from sklearn.linear_model import LogisticRegression from sklearn.metrics import confusion_matrix import matplotlib.pyplot as plt import numpy as np import pandas as pd import seaborn as sns import sys import math ########## arguments pnlty = str(sys.argv[1]) #l2 or l1 c = int(sys.argv[2]) #C = 1 by default. The larger the C, the weaker regularization is going to be. ########## Multinomial Logistic Regression with Regularitation ''' ##### generate dataset with TWO classes as the mixture of training data and test data np.random.seed(seed=0) X_0 = np.random.multivariate_normal( [2,2], [[2,0],[0,2]], 50 ) y_0 = np.zeros(len(X_0)) X_1 = np.random.multivariate_normal( [6,7], [[3,0],[0,3]], 50 ) y_1 = np.ones(len(X_1)) X = np.vstack((X_0, X_1)) #print(X) #print(type(X)) #<class 'numpy.ndarray'> y = np.append(y_0, y_1) #print(y) #print(type(y)) #<class 'numpy.ndarray'> ##### save dataset pd.DataFrame(data=X).to_csv("X.csv", header=False, index=False) pd.DataFrame(data=y).to_csv("y.csv", header=False, index=False) ''' ##### load raw dataset X = pd.read_csv('X.csv', header=None).values y = pd.read_csv('y.csv', header=None).values.ravel() #print(type(X)) #<class 'numpy.ndarray'> #print(type(y)) #<class 'numpy.ndarray'> ##### plot raw data plt.scatter(X[y==0, 0], X[y==0, 1], c='blue', marker='*', label='raw data 0') plt.scatter(X[y==1, 0], X[y==1, 1], c='red', marker='*', label='raw data 1') plt.legend(loc='upper left') plt.title('Raw Data') plt.xlabel('X1: Raw Data') plt.ylabel('X2: Raw Data') plt.savefig('Figure_1_Raw_Data.png') plt.show() plt.close() ##### splitting Training Data and Test Data #X_train, X_test, y_train, y_test = train_test_split(X, y, test_size=0.3) X_train, X_test, y_train, y_test = train_test_split(X, y, test_size=0.2, random_state=3) #random_state=3 is to fix results. You can change this number to, say, 1, 2, or any other integer you like. ##### Standardization of Training and Test Data (Average=0, SD=1) sc = StandardScaler() X_train_std = sc.fit_transform(X_train) X_test_std = sc.transform(X_test) ##### max and min of X and y xmax = max( max(X_train_std[y_train==0, 0]), max(X_train_std[y_train==1, 0]), max(X_test_std[y_test==0, 0]), max(X_test_std[y_test==1, 0]) ) # xmin = min( min(X_train_std[y_train==0, 0]), min(X_train_std[y_train==1, 0]), min(X_test_std[y_test==0, 0]), min(X_test_std[y_test==1, 0]) ) # # ymax = max( max(X_train_std[y_train==0, 1]), max(X_train_std[y_train==1, 1]), max(X_test_std[y_test==0, 1]), max(X_test_std[y_test==1, 1]) ) # ymin = min( min(X_train_std[y_train==0, 1]), min(X_train_std[y_train==1, 1]), min(X_test_std[y_test==0, 1]), min(X_test_std[y_test==1, 1]) ) ##### plot trainging and test Data plt.xlim([math.floor(xmin), math.ceil(xmax)]) plt.ylim([math.floor(ymin), math.ceil(ymax)]) plt.scatter(X_train_std[y_train==0, 0], X_train_std[y_train==0, 1], c='blue', marker='x', label='train 0') plt.scatter(X_train_std[y_train==1, 0], X_train_std[y_train==1, 1], c='red', marker='x', label='train 1') plt.scatter(X_test_std[y_test==0, 0], X_test_std[y_test==0, 1], c='blue', marker='o', s=60, label='test 0') plt.scatter(X_test_std[y_test==1, 0], X_test_std[y_test==1, 1], c='red', marker='o', s=60, label='test 1') plt.legend(loc='upper left') plt.title('Training Data and Test Data') plt.xlabel('X1: Training Data and Test Data') plt.ylabel('X2: Training Data and Test Data') plt.savefig('Figure_2_Traing_Data_and_Test_Data.png') plt.show() plt.close() ########## Logistic Regression built by Standardized Training Data #lr = LogisticRegression() lr = LogisticRegression(C=c, penalty=pnlty) lr.fit(X_train_std, y_train) #check predict and score #print(lr.predict(X_test_std)) #[1. 1. 0. 1. 1. 0. 1. 1. 0. 0. 1. 0. 1. 1. 0. 1. 1. 0. 1. 0.] # #print(y_test) #[1. 1. 0. 1. 1. 1. 1. 0. 0. 0. 1. 0. 1. 1. 0. 1. 1. 0. 1. 0.] # #print(lr.predict(X_test_std)) #[1. 1. 0. 1. 1. 0. 1. 1. 0. 0. 1. 0. 1. 1. 0. 1. 1. 0. 1. 0.] # #[T T T T T F T F T T T T T T T T T T T T ] #Number of T ( correct answers) = 18 #Number of F (incorrect answers) = 2 #18/(18+2) = 0.9 #print(lr.score(X_test_std, y_test)) #0.9 ''' A result of Logistic Regression is weights w0, w1, and w2 of a boundary line below: w0+w1x+w2y=0 w0 is stored in intercept_ while w1 and w2 are included in coef_. ''' #print (lr.intercept_) #[-0.09150732] #print (lr.coef_) #[[1.99471124 2.32334603]] w_0 = lr.intercept_[0] w_1 = lr.coef_[0,0] w_2 = lr.coef_[0,1] # a boundary line # w_0 + (w_1 * x) + (w_2 * y) = 0 # y = ((-w_1 * x) - w_0) / w_2 # print("y = ((-w_1 * x) - w_0) / w_2") print("y = (-w_1/w_2) * x - w_0/w_2") print("y: x2") print("x: x1") print("w_0 = ", w_0) print("w_1 = ", w_1) print("w_2 = ", w_2) print("(-w_1/w_2) = ", (-w_1/w_2)) print("(-w_0/w_2) = ", (-w_0/w_2)) ''' y = ((-w_1 * x) - w_0) / w_2 y = (-w_1/w_2) * x - w_0/w_2 y: x2 x: x1 w_0 = -0.09150731939635004 w_1 = 1.9947112354879184 w_2 = 2.3233460327656656 (-w_1/w_2) = -0.8585510756283915 (-w_0/w_2) = 0.03938600540162393 ''' # plotting a boundary line #plt.plot([-2,2], map(lambda x: (-w_1 * x - w_0)/w_2, [-2,2])) #plt.plot([-2,2], list(map(lambda x: (-w_1 * x - w_0)/w_2, [-2,2]))) plt.plot([math.floor(xmin) - 1, math.ceil(xmax) + 1], list(map(lambda x: (-w_1 * x - w_0)/w_2, [math.floor(xmin) - 1, math.ceil(xmax) + 1]))) # plotting Training Data and Test Data plt.xlim([math.floor(xmin), math.ceil(xmax)]) plt.ylim([math.floor(ymin), math.ceil(ymax)]) plt.scatter(X_train_std[y_train==0, 0], X_train_std[y_train==0, 1], c='blue', marker='x', label='train 0') plt.scatter(X_train_std[y_train==1, 0], X_train_std[y_train==1, 1], c='red', marker='x', label='train 1') plt.scatter(X_test_std[y_test==0, 0], X_test_std[y_test==0, 1], c='blue', marker='o', s=60, label='test 0') plt.scatter(X_test_std[y_test==1, 0], X_test_std[y_test==1, 1], c='red', marker='o', s=60, label='test 1') plt.legend(loc='upper left') plt.title('Training Data and Test Data plus a Boundary Line') plt.xlabel('X1: Training Data and Test Data') plt.ylabel('X2: Training Data and Test Data') #plt.text(-2,-2, 'Boundary Line: x2 = (-w_1/w_2) * x1 - w_0/w_2 = ' + str(-w_1/w_2) + ' * x1 + ' + str(-w_0/w_2), size=10) plt.text(math.floor(xmin) + (math.ceil(xmax) - math.floor(xmin)) * 0.05, math.floor(ymin) + (math.ceil(ymax) - math.floor(ymin)) * 0.20, 'Regularization: ' + str(pnlty), size=9) plt.text(math.floor(xmin) + (math.ceil(xmax) - math.floor(xmin)) * 0.05, math.floor(ymin) + (math.ceil(ymax) - math.floor(ymin)) * 0.15, 'c = ' + str(c), size=9) plt.text(math.floor(xmin) + (math.ceil(xmax) - math.floor(xmin)) * 0.05, math.floor(ymin) + (math.ceil(ymax) - math.floor(ymin)) * 0.10, 'Test score = ' + str(round(lr.score(X_test_std, y_test),3)*100) + '%', size=9) plt.text(math.floor(xmin) + (math.ceil(xmax) - math.floor(xmin)) * 0.05, math.floor(ymin) + (math.ceil(ymax) - math.floor(ymin)) * 0.05, 'Boundary Line: x2 = ' + str(-w_1/w_2) + ' * x1 + ' + str(-w_0/w_2), size=9) plt.savefig('Figure_3_Traing_Data_and_Test_Data_plus_Boundary_Line.png') plt.show() plt.close() ##### Confusion Matrix cm = confusion_matrix(y_test, lr.predict(X_test_std)) print ("Confusion Matrix : \n", cm) ''' Confusion Matrix : Confusion Matrix : [[ 7 1] [ 0 12]] ''' ''' Out of 20 : TruePostive + TrueNegative = 12 + 7 FalsePositive + FalseNegative = 1 + 0 [[TrueNegative(TN) FalsePositive(FP)] [ FalseNegative(FN) TruePositive(TP)]] Predicted Labels: Negative Positive Actual Results: Negative TrueNegative(TN) FalsePositive(FP) Positive FalseNegative(FN) TruePositive(TP) ''' #use 1, 2 as there are two independent variables x1 and x2 class_names=[1,2] #fig, ax = plt.subplots() fig, ax = plt.subplots(figsize=(6,5)) tick_marks = np.arange(len(class_names)) plt.xticks(tick_marks, class_names) plt.yticks(tick_marks, class_names) #sns.heatmap(pd.DataFrame(cm), annot=True, cmap="Blues" ,fmt='g') sns.heatmap(pd.DataFrame(cm), annot=True, cmap="coolwarm", fmt='g') ax.xaxis.set_label_position("top") #plt.tight_layout() plt.tight_layout(pad=3.00) plt.title('Confusion Matrix (Test Data)') plt.xlabel('Predicted Labels') plt.ylabel('Actual Results') #print("Accuracy:",metrics.accuracy_score(y_test, y_pred)) plt.savefig("Figure_4_Confusion_Matrix_Test_Data.png") plt.show() plt.close() ########## Logistic Regression built by Standardized Training Data (+ Regularization parameter C) ''' The larger the C, the weaker regularization is going to be. C is 1.0 by default. We try 1, 10, 100, 1000 here. ''' fig, axs = plt.subplots(2, 2, sharex=True, sharey=True) plt.xlim([math.floor(xmin), math.ceil(xmax)]) plt.ylim([math.floor(ymin), math.ceil(ymax)]) plt.subplots_adjust(wspace=0.1, hspace=0.6) c_params = [1.0, 10.0, 100.0, 1000.0] #print(c_params) #[1.0, 10.0, 100.0, 1000.0] # #print(type(c_params)) #<class 'list'> #print(enumerate(c_params)) #<enumerate object at 0x127bec500> for i, c in enumerate(c_params): #print(i, c) # #lr = LogisticRegression(C=c) lr = LogisticRegression(C=c, penalty=pnlty) lr.fit(X_train_std, y_train) # w_0 = lr.intercept_[0] w_1 = lr.coef_[0,0] w_2 = lr.coef_[0,1] score = lr.score(X_test_std, y_test) # #print(i/2, i%2) #print(math.floor(i/2), i%2) #####axs[i/2, i%2].set_title('C=' + str(c)) axs[math.floor(i/2), i%2].set_title('C=' + str(c)) # #####axs[i/2, i%2].plot([-2,2], map(lambda x: (-w_1 * x - w_0)/w_2, [-2,2])) axs[math.floor(i/2), i%2].plot([math.floor(xmin)-1, math.ceil(xmax)+1], list(map(lambda x: (-w_1 * x - w_0)/w_2, [math.floor(xmin)-1, math.ceil(xmax)+1]))) # #####axs[i/2, i%2].scatter(X_train_std[y_train==0, 0], X_train_std[y_train==0, 1], c='red', marker='x', label='train 0') #axs[math.floor(i/2), i%2].scatter(X_train_std[y_train==0, 0], X_train_std[y_train==0, 1], c='red', marker='x', label='train 0') axs[math.floor(i/2), i%2].scatter(X_train_std[y_train==0, 0], X_train_std[y_train==0, 1], c='blue', marker='x', label='train 0') # #####axs[i/2, i%2].scatter(X_train_std[y_train==1, 0], X_train_std[y_train==1, 1], c='blue', marker='x', label='train 1') #axs[math.floor(i/2), i%2].scatter(X_train_std[y_train==1, 0], X_train_std[y_train==1, 1], c='blue', marker='x', label='train 1') axs[math.floor(i/2), i%2].scatter(X_train_std[y_train==1, 0], X_train_std[y_train==1, 1], c='red', marker='x', label='train 1') # #####axs[i/2, i%2].scatter(X_test_std[y_test==0, 0], X_test_std[y_test==0, 1], c='red', marker='o', s=60, label='test 0') #axs[math.floor(i/2), i%2].scatter(X_test_std[y_test==0, 0], X_test_std[y_test==0, 1], c='red', marker='o', s=60, label='test 0') axs[math.floor(i/2), i%2].scatter(X_test_std[y_test==0, 0], X_test_std[y_test==0, 1], c='blue', marker='o', s=60, label='test 0') # #####axs[i/2, i%2].scatter(X_test_std[y_test==1, 0], X_test_std[y_test==1, 1], c='blue', marker='o', s=60, label='test 1') #axs[math.floor(i/2), i%2].scatter(X_test_std[y_test==1, 0], X_test_std[y_test==1, 1], c='blue', marker='o', s=60, label='test 1') axs[math.floor(i/2), i%2].scatter(X_test_std[y_test==1, 0], X_test_std[y_test==1, 1], c='red', marker='o', s=60, label='test 1') # # if (i < 2): #####axs[i/2, i%2].text(0,-2.7, 'score ' + str(round(score,3)*100) + '%', size=13) axs[math.floor(i/2), i%2].text(math.floor(xmin) + (math.ceil(xmax) - math.floor(xmin)) * 0.10, math.ceil(ymax) - (math.ceil(ymax) - math.floor(ymin)) * 0.10, 'score ' + str(round(score,3)*100) + '%', size=10) else: #####axs[i/2, i%2].text(0,-3.3, 'score ' + str(round(score,3)*100) + '%', size=13) axs[math.floor(i/2), i%2].text(math.floor(xmin) + (math.ceil(xmax) - math.floor(xmin)) * 0.10, math.ceil(ymax) - (math.ceil(ymax) - math.floor(ymin)) * 0.10, 'score ' + str(round(score,3)*100) + '%', size=10) plt.savefig('Figure_5_Traing_Data_and_Test_Data_plus_Boundary_Line_for_various_Cs.png') plt.show() plt.close() |
Figures
Figure_1_Raw_Data.png
Figure_2_Traing_Data_and_Test_Data.png
Figure_3_Traing_Data_and_Test_Data_plus_Boundary_Line.png
Figure_4_Confusion_Matrix_Test_Data.png
Figure_5_Traing_Data_and_Test_Data_plus_Boundary_Line_for_various_Cs.png


No comments:
Post a Comment