AdSense

Sunday, May 31, 2020

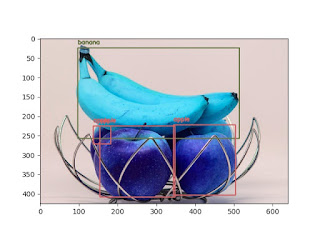
Object Detection with Less Than 10 Lines of Python Code

Object Detection with Less Than 10 Lines of Python Code


0_MacOS_Python_setup.txt
# Install on Terminal of MacOS

#pip3 install -U opencv-python

#pip3 install -U cvlib

#pip3 install -U matplotlib

#pip3 install -U tensorflow


1_MacOS_Terminal.txt
########## Run Terminal on MacOS and execute
### TO UPDATE
cd "YOUR_WORKING_DIRECTORY"


python3 od01.py 1.jpeg

python3 od01.py 2.jpeg

python3 od01.py 3.jpeg

python3 od01.py 4.jpg


Image files

1.jpeg


2.jpeg


3.jpeg


4.jpg


Python files

od01.py
########## Object Detection with Less Than 10 Lines of Python Code ##########

# Save image files from the following website:
# https://towardsdatascience.com/object-detection-with-less-than-10-lines-of-code-using-python-2d28eebc5b11
# https://stackabuse.com/object-detection-with-imageai-in-python/

# Run this script on Terminal of MacOS as follows:
#
# python3 od01.py 1.jpeg
#
# More generally,
# python3 od01.py (image file name)


# Reference
#
# Object Detection with Less Than 10 Lines of Code Using Python
# Find out what objects are in the image
# by Sabina Pokhrel
# https://towardsdatascience.com/object-detection-with-less-than-10-lines-of-code-using-python-2d28eebc5b11


import cv2
import matplotlib.pyplot as plt
import cvlib as cv
from cvlib.object_detection import draw_bbox
import sys


imtmp = sys.argv[1]


im = cv2.imread(imtmp)

bbox, label, conf = cv.detect_common_objects(im)
output_image = draw_bbox(im, bbox, label, conf)
plt.imshow(output_image)
plt.savefig("Objects_detected_" + imtmp)
plt.show()


Output images
Objects_detected_1.jpeg


Objects_detected_2.jpeg


Objects_detected_3.jpeg


Objects_detected_4.jpg


References
Download csv data from the following website and save it to your working directory (where the lgrs01.py script is saved):
https://drive.google.com/open?id=1Upqoz2gIAYq6LByD7YjHU-9_9K4EOhOh
User_Data.csv

Saturday, May 30, 2020

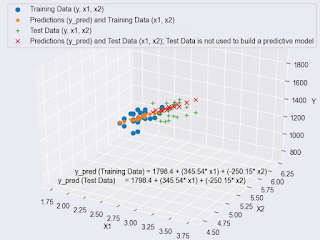
Multiple Linear Regression in Python (Training Data, Predictive Model Building by Training Data, Test Data, and Model Predictions for Test Data)

Multiple Linear Regression in Python (Training Data, Predictive Model Building by Training Data, Test Data, and Model Predictions for Test Data) 


0_MacOS_Python_setup.txt
# Install on Terminal of MacOS

# 1. pandas
#pip3 install -U pandas

# 2. matplotlib, from mpl_toolkits.mplot3d import Axes3D
#pip3 install -U matplotlib

# 3. scikit-learn (sklearn)
#pip3 install -U scikit-learn

# 4. statsmodels
#pip3 install -U statsmodels

# 5. tkinter
#pip3 install -U tkinter

# 6. NumPy
#pip3 install -U numpy

# 7. seaborn
#pip3 install -U seaborn


1_MacOS_Terminal.txt
########## Run Terminal on MacOS and execute
### TO UPDATE
cd "YOUR_WORKING_DIRECTORY"


python3 lrm03.py training.csv test.csv


Data files


training.csv
Year,Month,x1,x2,y
2017,12,2.75,5.3,1464.00
2017,11,2.5,5.3,1394.00
2017,10,2.5,5.3,1357.00
2017,9,2.5,5.3,1293.00
2017,8,2.5,5.4,1256.00
2017,7,2.5,5.6,1254.00
2017,6,2.5,5.5,1234.00
2017,5,2.25,5.5,1195.00
2017,4,2.25,5.5,1159.00
2017,3,2.25,5.6,1167.00
2017,2,2,5.7,1130.00
2017,1,2,5.9,1075.00
2016,12,2,6,1047.00
2016,11,1.75,5.9,965.00
2016,10,1.75,5.8,943.00
2016,9,1.75,6.1,958.00
2016,8,1.75,6.2,971.00
2016,7,1.75,6.1,949.00
2016,6,1.75,6.1,884.00
2016,5,1.75,6.1,866.00
2016,4,1.75,5.9,876.00
2016,3,1.75,6.2,822.00
2016,2,1.75,6.2,704.00
2016,1,1.75,6.1,719.00


test.csv
Year,Month,x1,x2,y
2019,12,3.75,4.5,1831.75
2019,11,3.5,4.5,1744.17
2019,10,3.5,4.7,1697.88
2019,9,3.5,4.7,1786.3
2019,8,3.25,4.8,1735.18
2019,7,3.25,4.8,1732.42
2019,6,3.25,4.7,1704.79
2019,5,3.25,4.7,1650.91
2019,4,3.25,4.7,1601.18
2019,3,3.25,4.8,1612.23
2019,2,3,4.9,1561.11
2019,1,3,4.9,1485.13
2018,12,3,5,1446.45
2018,11,3,4.9,1580.77
2018,10,3,4.8,1544.73
2018,9,3,5.1,1569.3
2018,8,3,5.2,1590.6
2018,7,3,5.1,1554.56
2018,6,3,5.3,1586.29
2018,5,3,5.3,1553.99
2018,4,2.75,5.1,1571.93
2018,3,2.75,5.4,1475.03
2018,2,2.75,5.4,1404.79
2018,1,2.75,5.3,1434.72


Python files

lrm03.py
########## Multiple Linear Regression in Python (Training Data, Predictive Model Building by Training Data, Test Data, and Model Predictions for Test Data) ##########
#
# Run this script on Terminal of MacOS as follows:
# python3 lrm01.py training.csv test.csv
#
# Reference:
# Example of Multiple Linear Regression in Python
# https://datatofish.com/multiple-linear-regression-python/


##### Checking for Linearity

import pandas as pd
import matplotlib.pyplot as plt
import sys
import numpy as np
import seaborn as sns
from mpl_toolkits.mplot3d import Axes3D


###training.csv
trainingcsv = sys.argv[1]    # the first argument after lrm01.py
#
# 'y' (dependent variable) : e.g., Stock_Index_Price
# 'x1' (independent variable 1) : e.g., Interest_Rate
# 'x2' (independent variable 2) : e.g., Unemployment_Rate
#
#
#trainingcsv = {'Year': [2017,2017,2017,2017,2017,2017,2017,2017,2017,2017,2017,2017,2016,2016,2016,2016,2016,2016,2016,2016,2016,2016,2016,2016],
#                'Month': [12, 11,10,9,8,7,6,5,4,3,2,1,12,11,10,9,8,7,6,5,4,3,2,1],
#                'x1': [2.75,2.5,2.5,2.5,2.5,2.5,2.5,2.25,2.25,2.25,2,2,2,1.75,1.75,1.75,1.75,1.75,1.75,1.75,1.75,1.75,1.75,1.75],
#                'x2': [5.3,5.3,5.3,5.3,5.4,5.6,5.5,5.5,5.5,5.6,5.7,5.9,6,5.9,5.8,6.1,6.2,6.1,6.1,6.1,5.9,6.2,6.2,6.1],
#                'y': [1464,1394,1357,1293,1256,1254,1234,1195,1159,1167,1130,1075,1047,965,943,958,971,949,884,866,876,822,704,719]      
#                }
#
#df = pd.DataFrame(trainingcsv,columns=['Year','Month','x1','x2','y'])


###test.csv
testcsv = sys.argv[2]    # the second argument after lrm01.py


### Read csv files
#
#training data
dftmp = pd.read_csv(trainingcsv, index_col=0)
#dfnp = dftmp.values    #covert pandas to numpy.ndarray
df = dftmp
#
#
#test data
dftesttmp = pd.read_csv(testcsv, index_col=0)
#dftestnp = dftesttmp.values    #covert pandas to numpy.ndarray
dftest = dftesttmp


### plot 1: Training Data y and x1
#
# 'y' (dependent variable) : e.g., Stock_Index_Price
# 'x1' (independent variable 1) : e.g., Interest_Rate
#
plt.scatter(df['x1'], df['y'], color='red', label="Training Data y and x1")
plt.legend()
plt.title('y vs x1', fontsize=14)
plt.xlabel('x1', fontsize=14)
plt.ylabel('y', fontsize=14)
plt.grid(True)
plt.savefig("Figure_1_y_x1_training.png")    # added to save a figure
plt.show()


### plot 2: Training Data y and x2
#
# 'y' (dependent variable) : e.g., Stock_Index_Price
# 'x2' (independent variable 2) : e.g., Unemployment_Rate
#
plt.scatter(df['x2'], df['y'], color='green', label="Training Data y and x2")
plt.legend()
plt.title('y vs x2', fontsize=14)
plt.xlabel('x2', fontsize=14)
plt.ylabel('y', fontsize=14)
plt.grid(True)
plt.savefig("Figure_2_y_x2_training.png")    # added to save a figure
plt.show()


### plot 3: Test Data y and x1
#
# 'y' (dependent variable) : e.g., Stock_Index_Price
# 'x1' (independent variable 1) : e.g., Interest_Rate
#
plt.scatter(dftest['x1'], dftest['y'], color='red', label="Test Data y and x1")
plt.legend()
plt.title('y vs x1', fontsize=14)
plt.xlabel('x1', fontsize=14)
plt.ylabel('y', fontsize=14)
plt.grid(True)
plt.savefig("Figure_3_y_x1_test.png")    # added to save a figure
plt.show()


### plot 4: Test Data y and x2
#
# 'y' (dependent variable) : e.g., Stock_Index_Price
# 'x2' (independent variable 2) : e.g., Unemployment_Rate
#
plt.scatter(dftest['x2'], dftest['y'], color='green', label="Test Data y and x2")
plt.legend()
plt.title('y vs x2', fontsize=14)
plt.xlabel('x2', fontsize=14)
plt.ylabel('y', fontsize=14)
plt.grid(True)
plt.savefig("Figure_4_y_x2_test.png")    # added to save a figure
plt.show()


##### Performing the Multiple Linear Regression (for Training Data)

from sklearn import linear_model
import statsmodels.api as sm


X = df[['x1','x2']]
Y = df['y']


### with sklearn
regr = linear_model.LinearRegression()
regr.fit(X, Y)

print('\n')
print('==============================')
print('Prediction model (for Training Data): \n')
print('Intercept: \n', regr.intercept_)
print('Coefficients: \n', regr.coef_)


with open('coef.txt', 'w') as f:
  print('Intercept: ' + str(regr.intercept_), file=f)
  print('Coefficients:' + str(regr.coef_), file=f)


### with statsmodels
X = sm.add_constant(X) # adding a constant
#
# X: raw training data that has const=1, x1, and x2.
pd.DataFrame(data=X).to_csv("X.csv", header=True, index=False)


model = sm.OLS(Y, X).fit()
predictions = model.predict(X)
#
# YPRED
#     y      : raw data Y
#     y_pred : predicted data by using raw training data x1 and x2 plus intercentpt.
YYPRED = pd.concat([Y, predictions], axis=1).rename(columns={0: 'y_pred'})
pd.DataFrame(data=YYPRED).to_csv("YYPRED.csv", header=True, index=False)
#
#resultstmp have: y, y_pred, const, x1, and x2; all data except for y_pred & const=1 are raw training data
resultstmp = pd.concat([YYPRED, X], axis=1)
#print(resultstmp)
resultstmp.to_csv("resultstmp.csv", header=True, index=False)
#
resultsint = pd.Series(regr.intercept_, index=resultstmp.index, name='coef_const')
resultscoef1 = pd.Series(regr.coef_[0], index=resultstmp.index, name='coef_x1')
resultscoef2 = pd.Series(regr.coef_[1], index=resultstmp.index, name='coef_x2')
#
pd.DataFrame(data=resultsint).to_csv("resultsint.csv", header=True, index=False)
pd.DataFrame(data=resultscoef1).to_csv("resultscoef1.csv", header=True, index=False)
pd.DataFrame(data=resultscoef2).to_csv("resultscoef2.csv", header=True, index=False)
#
RESULTS = pd.concat([resultstmp, resultsint, resultscoef1, resultscoef2], axis=1)
RESULTS.to_csv("RESULTS.csv", header=True, index=False)
# See "RESULTS.csv"
# y, y_pred, const, x1, x2, coef_const, coef_x1, and coef_x2; the last three were coefficients for intercept, x1, and x2, respectively.
#
# For instance,
# y_pred (B2) = F2*C2 + G2*D2 + H2*E2
# y_pred (B2) = coef_const(F2)*const(C2) + coef_1(G2)*x1(D2) + coef_1(H2)*x2(E2)
# 1422.862389 = 1798.403978*1 + 345.540087*2.75 + (-250.1465714)*5.3


print_model = model.summary()
print(print_model)


'''
Intercept:
 1798.4039776258546
Coefficients:
 [ 345.54008701 -250.14657137]
Predicted y:
 [1422.86238865]
                            OLS Regression Results                          
==============================================================================
Dep. Variable:      Stock_Index_Price   R-squared:                       0.898
Model:                            OLS   Adj. R-squared:                  0.888
Method:                 Least Squares   F-statistic:                     92.07
Date:                Fri, 29 May 2020   Prob (F-statistic):           4.04e-11
Time:                        08:43:16   Log-Likelihood:                -134.61
No. Observations:                  24   AIC:                             275.2
Df Residuals:                      21   BIC:                             278.8
Df Model:                           2                                        
Covariance Type:            nonrobust                                        
==============================================================================
                 coef    std err          t      P>|t|      [0.025      0.975]
------------------------------------------------------------------------------
const       1798.4040    899.248      2.000      0.059     -71.685    3668.493
x1           345.5401    111.367      3.103      0.005     113.940     577.140
x2          -250.1466    117.950     -2.121      0.046    -495.437      -4.856
==============================================================================
Omnibus:                        2.691   Durbin-Watson:                   0.530
Prob(Omnibus):                  0.260   Jarque-Bera (JB):                1.551
Skew:                          -0.612   Prob(JB):                        0.461
Kurtosis:                       3.226   Cond. No.                         394.
==============================================================================

Warnings:
[1] Standard Errors assume that the covariance matrix of the errors is correctly specified.

'''


##### Applying the Multiple Linear Regression (to Test Data)

#from sklearn import linear_model
#import statsmodels.api as sm


XTEST = dftest[['x1','x2']]
YTEST = dftest['y']


### with statsmodels
XTEST = sm.add_constant(XTEST) # adding a constant
#
# XTEST: raw test data that has const=1, x1, and x2.
pd.DataFrame(data=XTEST).to_csv("XTEST.csv", header=True, index=False)


#modeltest = sm.OLS(YTEST, XTEST).fit()    # Test Data is not used to build a model.
#predictionstest = modeltest.predict(XTEST)    # Test Data is not used to build a model.
predictionstest = model.predict(XTEST)
#
# YTESTPRED
#     y      : raw data YTEST
#     y_pred : predicted data by using raw training data x1 and x2 plus intercept.
YYPREDTEST = pd.concat([YTEST, predictionstest], axis=1).rename(columns={0: 'y_pred'})
pd.DataFrame(data=YYPREDTEST).to_csv("YYPREDTEST.csv", header=True, index=False)
#
resultstmptest = pd.concat([YYPREDTEST, XTEST], axis=1)
#
resultstmptest.to_csv("resultstmptest.csv", header=True, index=False)
#
resultsinttest = pd.Series(regr.intercept_, index=resultstmptest.index, name='coef_const')
pd.DataFrame(data=resultsinttest).to_csv("resultsinttest.csv", header=True, index=False)
#
resultscoef1test = pd.Series(regr.coef_[0], index=resultstmptest.index, name='coef_x1')
pd.DataFrame(data=resultscoef1test).to_csv("resultscoef1test.csv", header=True, index=False)
#
resultscoef2test = pd.Series(regr.coef_[1], index=resultstmptest.index, name='coef_x2')
pd.DataFrame(data=resultscoef2test).to_csv("resultscoef2test.csv", header=True, index=False)
#


pd.concat([resultstmptest, resultsinttest, resultscoef1test, resultscoef2test], axis=1)

RESULTSTEST = pd.concat([resultstmptest, resultsinttest, resultscoef1test, resultscoef2test], axis=1)
RESULTSTEST.to_csv("RESULTSTEST.csv", header=True, index=False)


##### 3D plot


###Training Data: df (y, x1, x2)
XXX = df[['x1']]
YYY = df[['x2']]
ZZZ = df['y']


### Predictions (y_pred) and Training Data (y, x1, x2)
ZZZPRED = YYPRED['y_pred']


### Test Data: dftest (y, x1, x2)
XXXTEST = dftest[['x1']]
YYYTEST = dftest[['x2']]
ZZZTEST = dftest['y']


### Predictions (y_pred) and Test Data (y, x1, x2); Test Data is not used to build a predictive model
ZZZPREDTEST = YYPREDTEST['y_pred']


###graph
sns.set_style("darkgrid")
#
#frames of a graph
fig = plt.figure()
ax = Axes3D(fig)
#
#axis labels
ax.set_xlabel("X1")
ax.set_ylabel("X2")
ax.set_zlabel("Y")


###plot
##linestyle='None' means no line
#
# Training Data (y, x1, x2)
ax.plot(XXX,YYY,ZZZ, marker="o",linestyle='None', label='Training Data (y, x1, x2)')
#
# Predictions (y_pred) and Training Data (x1, x2)
ax.plot(XXX,YYY,ZZZPRED, marker="*", linestyle='None', label='Predictions (y_pred) and Training Data (x1, x2)')
#
# Test Data (y, x1, x2)
ax.plot(XXXTEST,YYYTEST,ZZZTEST, marker="+", linestyle='None', label='Test Data (y, x1, x2)')
#
# Predictions (y_pred) and Test Data (x1, x2)
ax.plot(XXXTEST,YYYTEST,ZZZPREDTEST, marker="x", linestyle='None', label='Predictions (y_pred) and Test Data (x1, x2); Test Data is not used to build a predictive model')


ax.legend()


###show a prediction equation on the plot
#
minx = min(XXX.min()[0],XXXTEST.min()[0])
miny = min(YYY.min()[0], YYYTEST.min()[0])
minz = min(ZZZ.min(), ZZZPRED.min(), ZZZTEST.min(), ZZZPREDTEST.min())
#
ax.text(minx + (abs(minx) * 0.05), miny + (abs(miny) * 0.05), minz + (abs(minz) * 0.05), 'y_pred (Training Data) = ' + str(np.round(regr.intercept_, decimals=2)) + ' + (' + str(np.round(regr.coef_[0], decimals=2)) + '* x1) + (' + str(np.round(regr.coef_[1], decimals=2)) + '* x2)', color='black')
ax.text(minx, miny, minz, 'y_pred (Test Data)     = ' + str(np.round(regr.intercept_, decimals=2)) + ' + (' + str(np.round(regr.coef_[0], decimals=2)) + '* x1) + (' + str(np.round(regr.coef_[1], decimals=2)) + '* x2)', color='black')


plt.savefig("Figure_5_y_x1_x2_y_pred_training_data_n_predictive_model_results_and_test_data_n_model_predications.png")    # added to save a figure
plt.show()


Figures
Figure_1_y_x1_training.png


Figure_2_y_x2_training.png

Figure_3_y_x1_test.png


Figure_4_y_x2_test.png


Figure_3_y_x1_x2_y_pred_training_data_n_predictive_model_results_and_test_data_n_model_predications


References

Example of Multiple Linear Regression in Python

Friday, May 29, 2020

Multiple Linear Regression in Python (Predictions by Training Data and Test Data)

Multiple Linear Regression in Python (Predictions by Training Data and Test Data) 


0_MacOS_Python_setup.txt
# Install on Terminal of MacOS

# 1. pandas
#pip3 install -U pandas

# 2. matplotlib, from mpl_toolkits.mplot3d import Axes3D
#pip3 install -U matplotlib

# 3. scikit-learn (sklearn)
#pip3 install -U scikit-learn

# 4. statsmodels
#pip3 install -U statsmodels

# 5. tkinter
#pip3 install -U tkinter

# 6. NumPy
#pip3 install -U numpy

# 7. seaborn
#pip3 install -U seaborn


1_MacOS_Terminal.txt
########## Run Terminal on MacOS and execute
### TO UPDATE
cd "YOUR_WORKING_DIRECTORY"


python3 lrm02.py training.csv test.csv


Data files


training.csv
Year,Month,x1,x2,y
2017,12,2.75,5.3,1464.00
2017,11,2.5,5.3,1394.00
2017,10,2.5,5.3,1357.00
2017,9,2.5,5.3,1293.00
2017,8,2.5,5.4,1256.00
2017,7,2.5,5.6,1254.00
2017,6,2.5,5.5,1234.00
2017,5,2.25,5.5,1195.00
2017,4,2.25,5.5,1159.00
2017,3,2.25,5.6,1167.00
2017,2,2,5.7,1130.00
2017,1,2,5.9,1075.00
2016,12,2,6,1047.00
2016,11,1.75,5.9,965.00
2016,10,1.75,5.8,943.00
2016,9,1.75,6.1,958.00
2016,8,1.75,6.2,971.00
2016,7,1.75,6.1,949.00
2016,6,1.75,6.1,884.00
2016,5,1.75,6.1,866.00
2016,4,1.75,5.9,876.00
2016,3,1.75,6.2,822.00
2016,2,1.75,6.2,704.00
2016,1,1.75,6.1,719.00


test.csv
Year,Month,x1,x2,y
2019,12,3.75,4.5,1831.75
2019,11,3.5,4.5,1744.17
2019,10,3.5,4.7,1697.88
2019,9,3.5,4.7,1786.3
2019,8,3.25,4.8,1735.18
2019,7,3.25,4.8,1732.42
2019,6,3.25,4.7,1704.79
2019,5,3.25,4.7,1650.91
2019,4,3.25,4.7,1601.18
2019,3,3.25,4.8,1612.23
2019,2,3,4.9,1561.11
2019,1,3,4.9,1485.13
2018,12,3,5,1446.45
2018,11,3,4.9,1580.77
2018,10,3,4.8,1544.73
2018,9,3,5.1,1569.3
2018,8,3,5.2,1590.6
2018,7,3,5.1,1554.56
2018,6,3,5.3,1586.29
2018,5,3,5.3,1553.99
2018,4,2.75,5.1,1571.93
2018,3,2.75,5.4,1475.03
2018,2,2.75,5.4,1404.79
2018,1,2.75,5.3,1434.72


Python files

lrm02.py
########## Multiple Linear Regression in Python (Predictions by Training Data and Test Data) ##########
#
# Run this script on Terminal of MacOS as follows:
# python3 lrm01.py training.csv test.csv
#
# Reference:
# Example of Multiple Linear Regression in Python
# https://datatofish.com/multiple-linear-regression-python/


##### Checking for Linearity

import pandas as pd
import matplotlib.pyplot as plt
import sys
import numpy as np
import seaborn as sns
from mpl_toolkits.mplot3d import Axes3D


###training.csv
trainingcsv = sys.argv[1]    # the first argument after lrm01.py
#
# 'y' (dependent variable) : e.g., Stock_Index_Price
# 'x1' (independent variable 1) : e.g., Interest_Rate
# 'x2' (independent variable 2) : e.g., Unemployment_Rate
#
#
#trainingcsv = {'Year': [2017,2017,2017,2017,2017,2017,2017,2017,2017,2017,2017,2017,2016,2016,2016,2016,2016,2016,2016,2016,2016,2016,2016,2016],
#                'Month': [12, 11,10,9,8,7,6,5,4,3,2,1,12,11,10,9,8,7,6,5,4,3,2,1],
#                'x1': [2.75,2.5,2.5,2.5,2.5,2.5,2.5,2.25,2.25,2.25,2,2,2,1.75,1.75,1.75,1.75,1.75,1.75,1.75,1.75,1.75,1.75,1.75],
#                'x2': [5.3,5.3,5.3,5.3,5.4,5.6,5.5,5.5,5.5,5.6,5.7,5.9,6,5.9,5.8,6.1,6.2,6.1,6.1,6.1,5.9,6.2,6.2,6.1],
#                'y': [1464,1394,1357,1293,1256,1254,1234,1195,1159,1167,1130,1075,1047,965,943,958,971,949,884,866,876,822,704,719]      
#                }
#
#df = pd.DataFrame(trainingcsv,columns=['Year','Month','x1','x2','y'])


###test.csv
testcsv = sys.argv[2]    # the second argument after lrm01.py


### Read csv files
#
#training data
dftmp = pd.read_csv(trainingcsv, index_col=0)
#dfnp = dftmp.values    #covert pandas to numpy.ndarray
df = dftmp
#
#
#test data
dftesttmp = pd.read_csv(testcsv, index_col=0)
#dftestnp = dftesttmp.values    #covert pandas to numpy.ndarray
dftest = dftesttmp


### plot 1
#
# 'y' (dependent variable) : e.g., Stock_Index_Price
# 'x1' (independent variable 1) : e.g., Interest_Rate
#
plt.scatter(df['x1'], df['y'], color='red', label="Training Data x1")
plt.legend()
plt.title('y vs x1', fontsize=14)
plt.xlabel('x1', fontsize=14)
plt.ylabel('y', fontsize=14)
plt.grid(True)
plt.savefig("Figure_1_y_x1_training.png")    # added to save a figure
plt.show()


### plot 2
#
# 'y' (dependent variable) : e.g., Stock_Index_Price
# 'x2' (independent variable 2) : e.g., Unemployment_Rate
#
plt.scatter(df['x2'], df['y'], color='green', label="Training Data x2")
plt.legend()
plt.title('y vs x2', fontsize=14)
plt.xlabel('x2', fontsize=14)
plt.ylabel('y', fontsize=14)
plt.grid(True)
plt.savefig("Figure_2_y_x2_training.png")    # added to save a figure
plt.show()


##### Performing the Multiple Linear Regression (for Training Data)

from sklearn import linear_model
import statsmodels.api as sm


X = df[['x1','x2']]
Y = df['y']


### with sklearn
regr = linear_model.LinearRegression()
regr.fit(X, Y)

print('\n')
print('==============================')
print('Prediction model (for Training Data): \n')
print('Intercept: \n', regr.intercept_)
print('Coefficients: \n', regr.coef_)


with open('coef.txt', 'w') as f:
  print('Intercept: ' + str(regr.intercept_), file=f)
  print('Coefficients:' + str(regr.coef_), file=f)


# prediction with sklearn
#new_x1 = 2.75
#new_x2 = 5.3
#print ('Predicted y: \n', regr.predict([[new_x1 ,new_x2]]))
#print('============================== \n')


### with statsmodels
X = sm.add_constant(X) # adding a constant
#
# X: raw training data that has const=1, x1, and x2.
pd.DataFrame(data=X).to_csv("X.csv", header=True, index=False)


model = sm.OLS(Y, X).fit()
predictions = model.predict(X)
#
# YPRED
#     y      : raw data Y
#     y_pred : predicted data by using raw training data x1 and x2 plus intercentpt.
YYPRED = pd.concat([Y, predictions], axis=1).rename(columns={0: 'y_pred'})
pd.DataFrame(data=YYPRED).to_csv("YYPRED.csv", header=True, index=False)
#
#resultstmp have: y, y_pred, const, x1, and x2; all data except for y_pred & const=1 are raw training data
resultstmp = pd.concat([YYPRED, X], axis=1)
resultstmp.to_csv("resultstmp.csv", header=True, index=False)
#
resultsint = pd.Series(regr.intercept_, index=resultstmp.index, name='coef_const')
resultscoef1 = pd.Series(regr.coef_[0], index=resultstmp.index, name='coef_x1')
resultscoef2 = pd.Series(regr.coef_[1], index=resultstmp.index, name='coef_x2')
#
RESULTS = pd.concat([resultstmp, resultsint, resultscoef1, resultscoef2], axis=1)
RESULTS.to_csv("RESULTS.csv", header=True, index=False)
# See "RESULTS.csv"
# y, y_pred, const, x1, x2, coef_const, coef_x1, and coef_x2; the last three were coefficients for intercept, x1, and x2, respectively.
#
# For instance,
# y_pred (B2) = F2*C2 + G2*D2 + H2*E2
# y_pred (B2) = coef_const(F2)*const(C2) + coef_1(G2)*x1(D2) + coef_1(H2)*x2(E2)
# 1422.862389 = 1798.403978*1 + 345.540087*2.75 + (-250.1465714)*5.3


print_model = model.summary()
print(print_model)


'''
Intercept:
 1798.4039776258546
Coefficients:
 [ 345.54008701 -250.14657137]
Predicted y:
 [1422.86238865]
                            OLS Regression Results                          
==============================================================================
Dep. Variable:      Stock_Index_Price   R-squared:                       0.898
Model:                            OLS   Adj. R-squared:                  0.888
Method:                 Least Squares   F-statistic:                     92.07
Date:                Fri, 29 May 2020   Prob (F-statistic):           4.04e-11
Time:                        08:43:16   Log-Likelihood:                -134.61
No. Observations:                  24   AIC:                             275.2
Df Residuals:                      21   BIC:                             278.8
Df Model:                           2                                        
Covariance Type:            nonrobust                                        
==============================================================================
                 coef    std err          t      P>|t|      [0.025      0.975]
------------------------------------------------------------------------------
const       1798.4040    899.248      2.000      0.059     -71.685    3668.493
x1           345.5401    111.367      3.103      0.005     113.940     577.140
x2          -250.1466    117.950     -2.121      0.046    -495.437      -4.856
==============================================================================
Omnibus:                        2.691   Durbin-Watson:                   0.530
Prob(Omnibus):                  0.260   Jarque-Bera (JB):                1.551
Skew:                          -0.612   Prob(JB):                        0.461
Kurtosis:                       3.226   Cond. No.                         394.
==============================================================================

Warnings:
[1] Standard Errors assume that the covariance matrix of the errors is correctly specified.

'''


##### Performing the Multiple Linear Regression (for Test Data)

#from sklearn import linear_model
#import statsmodels.api as sm


XTEST = dftest[['x1','x2']]
YTEST = dftest['y']


### with sklearn
regrtest = linear_model.LinearRegression()
regrtest.fit(XTEST, YTEST)

print('\n')
print('==============================')
print('Prediction model (for Test Data): \n')
print('Intercept: \n', regrtest.intercept_)
print('Coefficients: \n', regrtest.coef_)


with open('coeftest.txt', 'w') as f:
  print('Intercept: ' + str(regrtest.intercept_), file=f)
  print('Coefficients:' + str(regrtest.coef_), file=f)


# prediction with sklearn
#new_x1 = 2.75
#new_x2 = 5.3
#print ('Predicted y: \n', regr.predict([[new_x1 ,new_x2]]))
#print('============================== \n')


### with statsmodels
XTEST = sm.add_constant(XTEST) # adding a constant
#
# XTEST: raw test data that has const=1, x1, and x2.
pd.DataFrame(data=XTEST).to_csv("XTEST.csv", header=True, index=False)


modeltest = sm.OLS(YTEST, XTEST).fit()
predictionstest = modeltest.predict(XTEST)
#
# YTESTPRED
#     y      : raw data YTEST
#     y_pred : predicted data by using raw training data x1 and x2 plus intercentpt.
YYPREDTEST = pd.concat([YTEST, predictionstest], axis=1).rename(columns={0: 'y_pred'})
pd.DataFrame(data=YYPREDTEST).to_csv("YYPREDTEST.csv", header=True, index=False)
#
#resultstmp have: y, y_pred, const, x1, and x2; all data except for y_pred & const=1 are raw training data
resultstmptest = pd.concat([YYPREDTEST, XTEST], axis=1)
resultstmptest.to_csv("resultstmptest.csv", header=True, index=False)
#
resultsinttest = pd.Series(regrtest.intercept_, index=resultstmptest.index, name='coef_const')
resultscoef1test = pd.Series(regrtest.coef_[0], index=resultstmptest.index, name='coef_x1')
resultscoef2test = pd.Series(regrtest.coef_[1], index=resultstmptest.index, name='coef_x2')
#
RESULTSTEST = pd.concat([resultstmptest, resultsinttest, resultscoef1test, resultscoef2test], axis=1)
RESULTSTEST.to_csv("RESULTSTEST.csv", header=True, index=False)
# See "RESULTSTEST.csv"
# y, y_pred, const, x1, x2, coef_const, coef_x1, and coef_x2; the last three were coefficients for intercept, x1, and x2, respectively.
#
# For instance,
# y_pred (B2) = F2*C2 + G2*D2 + H2*E2
# y_pred (B2) = coef_const(F2)*const(C2) + coef_1(G2)*x1(D2) + coef_1(H2)*x2(E2)
# 1422.862389 = 1798.403978*1 + 345.540087*2.75 + (-250.1465714)*5.3


print_model_test = modeltest.summary()
print(print_model_test)


'''
==============================
Prediction model (for Test Data):

Intercept:
 468.67716948165594
Coefficients:
 [375.28267909  -7.11991846]
                            OLS Regression Results                          
==============================================================================
Dep. Variable:                      y   R-squared:                       0.795
Model:                            OLS   Adj. R-squared:                  0.776
Method:                 Least Squares   F-statistic:                     40.77
Date:                Sat, 30 May 2020   Prob (F-statistic):           5.87e-08
Time:                        10:44:30   Log-Likelihood:                -128.11
No. Observations:                  24   AIC:                             262.2
Df Residuals:                      21   BIC:                             265.8
Df Model:                           2                                        
Covariance Type:            nonrobust                                        
==============================================================================
                 coef    std err          t      P>|t|      [0.025      0.975]
------------------------------------------------------------------------------
const        468.6772    638.415      0.734      0.471    -858.979    1796.333
x1           375.2827     83.424      4.499      0.000     201.794     548.772
x2            -7.1199     81.061     -0.088      0.931    -175.696     161.456
==============================================================================
Omnibus:                        0.176   Durbin-Watson:                   1.282
Prob(Omnibus):                  0.916   Jarque-Bera (JB):                0.017
Skew:                           0.030   Prob(JB):                        0.992
Kurtosis:                       2.886   Cond. No.                         350.
==============================================================================

Warnings:
[1] Standard Errors assume that the covariance matrix of the errors is correctly specified.

'''


##### 3D plot


###Training Data: df (y, x1, x2)
XXX = df[['x1']]
YYY = df[['x2']]
ZZZ = df['y']


### Predictions (y_pred) by Training Data (y, x1, x2)
ZZZPRED = YYPRED['y_pred']


### Test Data: dftest (y, x1, x2)
XXXTEST = dftest[['x1']]
YYYTEST = dftest[['x2']]
ZZZTEST = dftest['y']


### Predictions (y_pred) by Test Data (y, x1, x2)
ZZZPREDTEST = YYPREDTEST['y_pred']


###graph
sns.set_style("darkgrid")
#
#frames of a graph
fig = plt.figure()
ax = Axes3D(fig)
#
#axis labels
ax.set_xlabel("X1")
ax.set_ylabel("X2")
ax.set_zlabel("Y")


###plot
##linestyle='None' means no line
#
# Training Data
ax.plot(XXX,YYY,ZZZ, marker="o",linestyle='None', label='Training Data')
#
# Predictions (y_pred) by Training Data (y, x1, x2)
ax.plot(XXX,YYY,ZZZPRED, marker="*", linestyle='None', label='Predictions by Training Data')
#
# Test Data
ax.plot(XXXTEST,YYYTEST,ZZZTEST, marker="+", linestyle='None', label='Test Data')
#
# Predictions (y_pred) by Test Data (y, x1, x2)
ax.plot(XXXTEST,YYYTEST,ZZZPREDTEST, marker="x", linestyle='None', label='Predictions by Test Data')


ax.legend()


###show a prediction equation on the plot
#
#print(XXX.min()[0])
#minx = XXX.min()[0]
minx = min(XXX.min()[0],XXXTEST.min()[0])
#
#print(min(YYY.min()[0], YYYTEST.min()[0]))
miny = min(YYY.min()[0], YYYTEST.min()[0])
#
#print(min(ZZZ.min(), ZZZPRED.min(), ZZZTEST.min()))
#minz = min(ZZZ.min(), ZZZPRED.min(), ZZZTEST.min())
minz = min(ZZZ.min(), ZZZPRED.min(), ZZZTEST.min(), ZZZPREDTEST.min())
#
#print('Intercept: \n', regr.intercept_)
#print(type(regr.intercept_))
#<class 'numpy.float64'>
#
#print('Coefficients: \n', regr.coef_)
#print(type(regr.coef_[0]))
#<class 'numpy.float64'>
#print(type(regr.coef_[1]))
#<class 'numpy.float64'>
#
#ax.text(minx, miny, minz, 'y_pred = ' + str(regr.intercept_) + ' + (' + str(regr.coef_[0]) + '* x1) + (' + str(regr.coef_[1]) + '* x2)', color='black')
#ax.text(minx, miny, minz, 'y_pred (Training Data) = ' + str(np.round(regr.intercept_, decimals=2)) + ' + (' + str(np.round(regr.coef_[0], decimals=2)) + '* x1) + (' + str(np.round(regr.coef_[1], decimals=2)) + '* x2)', color='black')
ax.text(minx + (abs(minx) * 0.15), miny + (abs(miny) * 0.15), minz + (abs(minz) * 0.15), 'y_pred (Training Data) = ' + str(np.round(regr.intercept_, decimals=2)) + ' + (' + str(np.round(regr.coef_[0], decimals=2)) + '* x1) + (' + str(np.round(regr.coef_[1], decimals=2)) + '* x2)', color='black')
ax.text(minx, miny, minz, 'y_pred (Test Data)     = ' + str(np.round(regrtest.intercept_, decimals=2)) + ' + (' + str(np.round(regrtest.coef_[0], decimals=2)) + '* x1) + (' + str(np.round(regrtest.coef_[1], decimals=2)) + '* x2)', color='black')


plt.savefig("Figure_3_y_x1_x2_training_n_predicted_and_test_n_predicated.png")    # added to save a figure
plt.show()


Figures
Figure_1_y_x1_training.png


Figure_2_y_x2_training.png


Figure_3_y_x1_x2_training_n_predicted_and_test_n_predicated.png


References

Example of Multiple Linear Regression in Python

Multiple Linear Regression in Python

Multiple Linear Regression in Python


0_MacOS_Python_setup.txt
# Install on Terminal of MacOS

# 1. pandas
#pip3 install -U pandas

# 2. matplotlib, from mpl_toolkits.mplot3d import Axes3D
#pip3 install -U matplotlib

# 3. scikit-learn (sklearn)
#pip3 install -U scikit-learn

# 4. statsmodels
#pip3 install -U statsmodels

# 5. tkinter
#pip3 install -U tkinter

# 6. NumPy
#pip3 install -U numpy

# 7. seaborn
#pip3 install -U seaborn


1_MacOS_Terminal.txt
########## Run Terminal on MacOS and execute
### TO UPDATE
cd "YOUR_WORKING_DIRECTORY"


python3 lrm01.py training.csv test.csv


Data files


training.csv
Year,Month,x1,x2,y
2017,12,2.75,5.3,1464.00
2017,11,2.5,5.3,1394.00
2017,10,2.5,5.3,1357.00
2017,9,2.5,5.3,1293.00
2017,8,2.5,5.4,1256.00
2017,7,2.5,5.6,1254.00
2017,6,2.5,5.5,1234.00
2017,5,2.25,5.5,1195.00
2017,4,2.25,5.5,1159.00
2017,3,2.25,5.6,1167.00
2017,2,2,5.7,1130.00
2017,1,2,5.9,1075.00
2016,12,2,6,1047.00
2016,11,1.75,5.9,965.00
2016,10,1.75,5.8,943.00
2016,9,1.75,6.1,958.00
2016,8,1.75,6.2,971.00
2016,7,1.75,6.1,949.00
2016,6,1.75,6.1,884.00
2016,5,1.75,6.1,866.00
2016,4,1.75,5.9,876.00
2016,3,1.75,6.2,822.00
2016,2,1.75,6.2,704.00
2016,1,1.75,6.1,719.00


test.csv
Year,Month,x1,x2,y
2019,12,3.75,4.5,1831.75
2019,11,3.5,4.5,1744.17
2019,10,3.5,4.7,1697.88
2019,9,3.5,4.7,1786.3
2019,8,3.25,4.8,1735.18
2019,7,3.25,4.8,1732.42
2019,6,3.25,4.7,1704.79
2019,5,3.25,4.7,1650.91
2019,4,3.25,4.7,1601.18
2019,3,3.25,4.8,1612.23
2019,2,3,4.9,1561.11
2019,1,3,4.9,1485.13
2018,12,3,5,1446.45
2018,11,3,4.9,1580.77
2018,10,3,4.8,1544.73
2018,9,3,5.1,1569.3
2018,8,3,5.2,1590.6
2018,7,3,5.1,1554.56
2018,6,3,5.3,1586.29
2018,5,3,5.3,1553.99
2018,4,2.75,5.1,1571.93
2018,3,2.75,5.4,1475.03
2018,2,2.75,5.4,1404.79
2018,1,2.75,5.3,1434.72


Python files

lrm01.py
########## Multiple Linear Regression in Python ##########
#
# Run this script on Terminal of MacOS as follows:
# python3 lrm01.py training.csv test.csv
#
# Reference:
# Example of Multiple Linear Regression in Python
# https://datatofish.com/multiple-linear-regression-python/


##### Checking for Linearity

import pandas as pd
import matplotlib.pyplot as plt
import sys
import numpy as np
import seaborn as sns
from mpl_toolkits.mplot3d import Axes3D


###training.csv
trainingcsv = sys.argv[1]    # the first argument after lrm01.py
#
# 'y' (dependent variable) : e.g., Stock_Index_Price
# 'x1' (independent variable 1) : e.g., Interest_Rate
# 'x2' (independent variable 2) : e.g., Unemployment_Rate
#
#
#trainingcsv = {'Year': [2017,2017,2017,2017,2017,2017,2017,2017,2017,2017,2017,2017,2016,2016,2016,2016,2016,2016,2016,2016,2016,2016,2016,2016],
#                'Month': [12, 11,10,9,8,7,6,5,4,3,2,1,12,11,10,9,8,7,6,5,4,3,2,1],
#                'x1': [2.75,2.5,2.5,2.5,2.5,2.5,2.5,2.25,2.25,2.25,2,2,2,1.75,1.75,1.75,1.75,1.75,1.75,1.75,1.75,1.75,1.75,1.75],
#                'x2': [5.3,5.3,5.3,5.3,5.4,5.6,5.5,5.5,5.5,5.6,5.7,5.9,6,5.9,5.8,6.1,6.2,6.1,6.1,6.1,5.9,6.2,6.2,6.1],
#                'y': [1464,1394,1357,1293,1256,1254,1234,1195,1159,1167,1130,1075,1047,965,943,958,971,949,884,866,876,822,704,719]      
#                }
#
#df = pd.DataFrame(trainingcsv,columns=['Year','Month','x1','x2','y'])


###test.csv
testcsv = sys.argv[2]    # the second argument after lrm01.py


### Read csv files
#
#training data
dftmp = pd.read_csv(trainingcsv, index_col=0)
#dfnp = dftmp.values    #covert pandas to numpy.ndarray
df = dftmp
#
#
#test data
dftesttmp = pd.read_csv(testcsv, index_col=0)
#dftestnp = dftesttmp.values    #covert pandas to numpy.ndarray
dftest = dftesttmp


### plot 1
#
# 'y' (dependent variable) : e.g., Stock_Index_Price
# 'x1' (independent variable 1) : e.g., Interest_Rate
#
plt.scatter(df['x1'], df['y'], color='red', label="Training Data x1")
plt.legend()
plt.title('y vs x1', fontsize=14)
plt.xlabel('x1', fontsize=14)
plt.ylabel('y', fontsize=14)
plt.grid(True)
plt.savefig("Figure_1_y_x1_training.png")    # added to save a figure
plt.show()


### plot 2
#
# 'y' (dependent variable) : e.g., Stock_Index_Price
# 'x2' (independent variable 2) : e.g., Unemployment_Rate
#
plt.scatter(df['x2'], df['y'], color='green', label="Training Data x2")
plt.legend()
plt.title('y vs x2', fontsize=14)
plt.xlabel('x2', fontsize=14)
plt.ylabel('y', fontsize=14)
plt.grid(True)
plt.savefig("Figure_2_y_x2_training.png")    # added to save a figure
plt.show()


##### Performing the Multiple Linear Regression

from sklearn import linear_model
import statsmodels.api as sm


X = df[['x1','x2']]
Y = df['y']


### with sklearn
regr = linear_model.LinearRegression()
regr.fit(X, Y)

print('\n')
print('==============================')
print('Prediction model: \n')
print('Intercept: \n', regr.intercept_)
print('Coefficients: \n', regr.coef_)


with open('coef.txt', 'w') as f:
  print('Intercept: ' + str(regr.intercept_), file=f)
  print('Coefficients:' + str(regr.coef_), file=f)


# prediction with sklearn
#new_x1 = 2.75
#new_x2 = 5.3
#print ('Predicted y: \n', regr.predict([[new_x1 ,new_x2]]))
#print('============================== \n')


### with statsmodels
X = sm.add_constant(X) # adding a constant
#
# X: raw training data that has const=1, x1, and x2.
pd.DataFrame(data=X).to_csv("X.csv", header=True, index=False)


model = sm.OLS(Y, X).fit()
predictions = model.predict(X)
#
# YPRED
#     y      : raw data Y
#     y_pred : predicted data by using raw training data x1 and x2 plus intercentpt.
YYPRED = pd.concat([Y, predictions], axis=1).rename(columns={0: 'y_pred'})
pd.DataFrame(data=YYPRED).to_csv("YYPRED.csv", header=True, index=False)
#
#resultstmp have: y, y_pred, const, x1, and x2; all data except for y_pred & const=1 are raw training data
resultstmp = pd.concat([YYPRED, X], axis=1)
resultstmp.to_csv("resultstmp.csv", header=True, index=False)
#
resultsint = pd.Series(regr.intercept_, index=resultstmp.index, name='coef_const')
resultscoef1 = pd.Series(regr.coef_[0], index=resultstmp.index, name='coef_x1')
resultscoef2 = pd.Series(regr.coef_[1], index=resultstmp.index, name='coef_x2')
#
RESULTS = pd.concat([resultstmp, resultsint, resultscoef1, resultscoef2], axis=1)
RESULTS.to_csv("RESULTS.csv", header=True, index=False)
# See "RESULTS.csv"
# y, y_pred, const, x1, x2, coef_const, coef_x1, and coef_x2; the last three were coefficients for intercept, x1, and x2, respectively.
#
# For instance,
# y_pred (B2) = F2*C2 + G2*D2 + H2*E2
# y_pred (B2) = coef_const(F2)*const(C2) + coef_1(G2)*x1(D2) + coef_1(H2)*x2(E2)
# 1422.862389 = 1798.403978*1 + 345.540087*2.75 + (-250.1465714)*5.3


print_model = model.summary()
print(print_model)


'''
Intercept:
 1798.4039776258546
Coefficients:
 [ 345.54008701 -250.14657137]
Predicted y:
 [1422.86238865]
                            OLS Regression Results                          
==============================================================================
Dep. Variable:      Stock_Index_Price   R-squared:                       0.898
Model:                            OLS   Adj. R-squared:                  0.888
Method:                 Least Squares   F-statistic:                     92.07
Date:                Fri, 29 May 2020   Prob (F-statistic):           4.04e-11
Time:                        08:43:16   Log-Likelihood:                -134.61
No. Observations:                  24   AIC:                             275.2
Df Residuals:                      21   BIC:                             278.8
Df Model:                           2                                        
Covariance Type:            nonrobust                                        
==============================================================================
                 coef    std err          t      P>|t|      [0.025      0.975]
------------------------------------------------------------------------------
const       1798.4040    899.248      2.000      0.059     -71.685    3668.493
x1           345.5401    111.367      3.103      0.005     113.940     577.140
x2          -250.1466    117.950     -2.121      0.046    -495.437      -4.856
==============================================================================
Omnibus:                        2.691   Durbin-Watson:                   0.530
Prob(Omnibus):                  0.260   Jarque-Bera (JB):                1.551
Skew:                          -0.612   Prob(JB):                        0.461
Kurtosis:                       3.226   Cond. No.                         394.
==============================================================================

Warnings:
[1] Standard Errors assume that the covariance matrix of the errors is correctly specified.

'''


##### 3D plot


###Training Data: df (y, x1, x2)
XXX = df[['x1']]
YYY = df[['x2']]
ZZZ = df['y']


### Predictions (y_pred) by Training Data (y, x1, x2)
ZZZPRED = YYPRED['y_pred']


### Test Data: dftest (y, x1, x2)
XXXTEST = dftest[['x1']]
YYYTEST = dftest[['x2']]
ZZZTEST = dftest['y']


###graph
sns.set_style("darkgrid")
#
#frames of a graph
fig = plt.figure()
ax = Axes3D(fig)
#
#axis labels
ax.set_xlabel("X1")
ax.set_ylabel("X2")
ax.set_zlabel("Y")


###plot
##linestyle='None' means no line
#
# Training Data
ax.plot(XXX,YYY,ZZZ, marker="o",linestyle='None', label='Training Data')
#
# Predictions (y_pred) by Training Data (y, x1, x2)
ax.plot(XXX,YYY,ZZZPRED, marker="*", linestyle='None', label='Predictions by Training Data')
#
# Test Data
ax.plot(XXXTEST,YYYTEST,ZZZTEST, marker="+", linestyle='None', label='Test Data')

ax.legend()


###show a prediction equation on the plot
#
#print(XXX.min()[0])
minx = XXX.min()[0]
#
#print(min(YYY.min()[0], YYYTEST.min()[0]))
miny = min(YYY.min()[0], YYYTEST.min()[0])
#
#print(min(ZZZ.min(), ZZZPRED.min(), ZZZTEST.min()))
minz = min(ZZZ.min(), ZZZPRED.min(), ZZZTEST.min())
#
#print('Intercept: \n', regr.intercept_)
#print(type(regr.intercept_))
#<class 'numpy.float64'>
#
#print('Coefficients: \n', regr.coef_)
#print(type(regr.coef_[0]))
#<class 'numpy.float64'>
#print(type(regr.coef_[1]))
#<class 'numpy.float64'>
#
#ax.text(minx, miny, minz, 'y_pred = ' + str(regr.intercept_) + ' + (' + str(regr.coef_[0]) + '* x1) + (' + str(regr.coef_[1]) + '* x2)', color='black')
ax.text(minx, miny, minz, 'y_pred = ' + str(np.round(regr.intercept_, decimals=2)) + ' + (' + str(np.round(regr.coef_[0], decimals=2)) + '* x1) + (' + str(np.round(regr.coef_[1], decimals=2)) + '* x2)', color='black')


plt.savefig("Figure_3_y_x1_x2_training_predicted_and_test_data.png")    # added to save a figure
plt.show()


Figures
Figure_1_y_x1_training.png


Figure_2_y_x2_training.png


Figure_3_y_x1_x2_training_predicted_and_test_data.png


References

Example of Multiple Linear Regression in Python

Deep Learning (Regression, Multiple Features/Explanatory Variables, Supervised Learning): Impelementation and Showing Biases and Weights

Deep Learning (Regression, Multiple Features/Explanatory Variables, Supervised Learning): Impelementation and Showing Biases and Weights ...