| # Install on Terminal of MacOS # 1. pandas #pip3 install -U pandas # 2. matplotlib, from mpl_toolkits.mplot3d import Axes3D #pip3 install -U matplotlib # 3. scikit-learn (sklearn) #pip3 install -U scikit-learn # 4. statsmodels #pip3 install -U statsmodels # 5. tkinter #pip3 install -U tkinter # 6. NumPy #pip3 install -U numpy # 7. seaborn #pip3 install -U seaborn |
1_MacOS_Terminal.txt
| ########## Run Terminal on MacOS and execute ### TO UPDATE cd "YOUR_WORKING_DIRECTORY" python3 lrm03.py training.csv test.csv |
Data files
training.csv
| Year,Month,x1,x2,y 2017,12,2.75,5.3,1464.00 2017,11,2.5,5.3,1394.00 2017,10,2.5,5.3,1357.00 2017,9,2.5,5.3,1293.00 2017,8,2.5,5.4,1256.00 2017,7,2.5,5.6,1254.00 2017,6,2.5,5.5,1234.00 2017,5,2.25,5.5,1195.00 2017,4,2.25,5.5,1159.00 2017,3,2.25,5.6,1167.00 2017,2,2,5.7,1130.00 2017,1,2,5.9,1075.00 2016,12,2,6,1047.00 2016,11,1.75,5.9,965.00 2016,10,1.75,5.8,943.00 2016,9,1.75,6.1,958.00 2016,8,1.75,6.2,971.00 2016,7,1.75,6.1,949.00 2016,6,1.75,6.1,884.00 2016,5,1.75,6.1,866.00 2016,4,1.75,5.9,876.00 2016,3,1.75,6.2,822.00 2016,2,1.75,6.2,704.00 2016,1,1.75,6.1,719.00 |
test.csv
| Year,Month,x1,x2,y 2019,12,3.75,4.5,1831.75 2019,11,3.5,4.5,1744.17 2019,10,3.5,4.7,1697.88 2019,9,3.5,4.7,1786.3 2019,8,3.25,4.8,1735.18 2019,7,3.25,4.8,1732.42 2019,6,3.25,4.7,1704.79 2019,5,3.25,4.7,1650.91 2019,4,3.25,4.7,1601.18 2019,3,3.25,4.8,1612.23 2019,2,3,4.9,1561.11 2019,1,3,4.9,1485.13 2018,12,3,5,1446.45 2018,11,3,4.9,1580.77 2018,10,3,4.8,1544.73 2018,9,3,5.1,1569.3 2018,8,3,5.2,1590.6 2018,7,3,5.1,1554.56 2018,6,3,5.3,1586.29 2018,5,3,5.3,1553.99 2018,4,2.75,5.1,1571.93 2018,3,2.75,5.4,1475.03 2018,2,2.75,5.4,1404.79 2018,1,2.75,5.3,1434.72 |
Python files
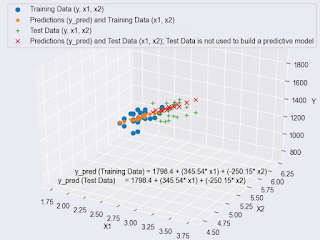
| ########## Multiple Linear Regression in Python (Training Data, Predictive Model Building by Training Data, Test Data, and Model Predictions for Test Data) ########## # # Run this script on Terminal of MacOS as follows: # python3 lrm01.py training.csv test.csv # # Reference: # Example of Multiple Linear Regression in Python # https://datatofish.com/multiple-linear-regression-python/ ##### Checking for Linearity import pandas as pd import matplotlib.pyplot as plt import sys import numpy as np import seaborn as sns from mpl_toolkits.mplot3d import Axes3D ###training.csv trainingcsv = sys.argv[1] # the first argument after lrm01.py # # 'y' (dependent variable) : e.g., Stock_Index_Price # 'x1' (independent variable 1) : e.g., Interest_Rate # 'x2' (independent variable 2) : e.g., Unemployment_Rate # # #trainingcsv = {'Year': [2017,2017,2017,2017,2017,2017,2017,2017,2017,2017,2017,2017,2016,2016,2016,2016,2016,2016,2016,2016,2016,2016,2016,2016], # 'Month': [12, 11,10,9,8,7,6,5,4,3,2,1,12,11,10,9,8,7,6,5,4,3,2,1], # 'x1': [2.75,2.5,2.5,2.5,2.5,2.5,2.5,2.25,2.25,2.25,2,2,2,1.75,1.75,1.75,1.75,1.75,1.75,1.75,1.75,1.75,1.75,1.75], # 'x2': [5.3,5.3,5.3,5.3,5.4,5.6,5.5,5.5,5.5,5.6,5.7,5.9,6,5.9,5.8,6.1,6.2,6.1,6.1,6.1,5.9,6.2,6.2,6.1], # 'y': [1464,1394,1357,1293,1256,1254,1234,1195,1159,1167,1130,1075,1047,965,943,958,971,949,884,866,876,822,704,719] # } # #df = pd.DataFrame(trainingcsv,columns=['Year','Month','x1','x2','y']) ###test.csv testcsv = sys.argv[2] # the second argument after lrm01.py ### Read csv files # #training data dftmp = pd.read_csv(trainingcsv, index_col=0) #dfnp = dftmp.values #covert pandas to numpy.ndarray df = dftmp # # #test data dftesttmp = pd.read_csv(testcsv, index_col=0) #dftestnp = dftesttmp.values #covert pandas to numpy.ndarray dftest = dftesttmp ### plot 1: Training Data y and x1 # # 'y' (dependent variable) : e.g., Stock_Index_Price # 'x1' (independent variable 1) : e.g., Interest_Rate # plt.scatter(df['x1'], df['y'], color='red', label="Training Data y and x1") plt.legend() plt.title('y vs x1', fontsize=14) plt.xlabel('x1', fontsize=14) plt.ylabel('y', fontsize=14) plt.grid(True) plt.savefig("Figure_1_y_x1_training.png") # added to save a figure plt.show() ### plot 2: Training Data y and x2 # # 'y' (dependent variable) : e.g., Stock_Index_Price # 'x2' (independent variable 2) : e.g., Unemployment_Rate # plt.scatter(df['x2'], df['y'], color='green', label="Training Data y and x2") plt.legend() plt.title('y vs x2', fontsize=14) plt.xlabel('x2', fontsize=14) plt.ylabel('y', fontsize=14) plt.grid(True) plt.savefig("Figure_2_y_x2_training.png") # added to save a figure plt.show() ### plot 3: Test Data y and x1 # # 'y' (dependent variable) : e.g., Stock_Index_Price # 'x1' (independent variable 1) : e.g., Interest_Rate # plt.scatter(dftest['x1'], dftest['y'], color='red', label="Test Data y and x1") plt.legend() plt.title('y vs x1', fontsize=14) plt.xlabel('x1', fontsize=14) plt.ylabel('y', fontsize=14) plt.grid(True) plt.savefig("Figure_3_y_x1_test.png") # added to save a figure plt.show() ### plot 4: Test Data y and x2 # # 'y' (dependent variable) : e.g., Stock_Index_Price # 'x2' (independent variable 2) : e.g., Unemployment_Rate # plt.scatter(dftest['x2'], dftest['y'], color='green', label="Test Data y and x2") plt.legend() plt.title('y vs x2', fontsize=14) plt.xlabel('x2', fontsize=14) plt.ylabel('y', fontsize=14) plt.grid(True) plt.savefig("Figure_4_y_x2_test.png") # added to save a figure plt.show() ##### Performing the Multiple Linear Regression (for Training Data) from sklearn import linear_model import statsmodels.api as sm X = df[['x1','x2']] Y = df['y'] ### with sklearn regr = linear_model.LinearRegression() regr.fit(X, Y) print('\n') print('==============================') print('Prediction model (for Training Data): \n') print('Intercept: \n', regr.intercept_) print('Coefficients: \n', regr.coef_) with open('coef.txt', 'w') as f: print('Intercept: ' + str(regr.intercept_), file=f) print('Coefficients:' + str(regr.coef_), file=f) ### with statsmodels X = sm.add_constant(X) # adding a constant # # X: raw training data that has const=1, x1, and x2. pd.DataFrame(data=X).to_csv("X.csv", header=True, index=False) model = sm.OLS(Y, X).fit() predictions = model.predict(X) # # YPRED # y : raw data Y # y_pred : predicted data by using raw training data x1 and x2 plus intercentpt. YYPRED = pd.concat([Y, predictions], axis=1).rename(columns={0: 'y_pred'}) pd.DataFrame(data=YYPRED).to_csv("YYPRED.csv", header=True, index=False) # #resultstmp have: y, y_pred, const, x1, and x2; all data except for y_pred & const=1 are raw training data resultstmp = pd.concat([YYPRED, X], axis=1) #print(resultstmp) resultstmp.to_csv("resultstmp.csv", header=True, index=False) # resultsint = pd.Series(regr.intercept_, index=resultstmp.index, name='coef_const') resultscoef1 = pd.Series(regr.coef_[0], index=resultstmp.index, name='coef_x1') resultscoef2 = pd.Series(regr.coef_[1], index=resultstmp.index, name='coef_x2') # pd.DataFrame(data=resultsint).to_csv("resultsint.csv", header=True, index=False) pd.DataFrame(data=resultscoef1).to_csv("resultscoef1.csv", header=True, index=False) pd.DataFrame(data=resultscoef2).to_csv("resultscoef2.csv", header=True, index=False) # RESULTS = pd.concat([resultstmp, resultsint, resultscoef1, resultscoef2], axis=1) RESULTS.to_csv("RESULTS.csv", header=True, index=False) # See "RESULTS.csv" # y, y_pred, const, x1, x2, coef_const, coef_x1, and coef_x2; the last three were coefficients for intercept, x1, and x2, respectively. # # For instance, # y_pred (B2) = F2*C2 + G2*D2 + H2*E2 # y_pred (B2) = coef_const(F2)*const(C2) + coef_1(G2)*x1(D2) + coef_1(H2)*x2(E2) # 1422.862389 = 1798.403978*1 + 345.540087*2.75 + (-250.1465714)*5.3 print_model = model.summary() print(print_model) ''' Intercept: 1798.4039776258546 Coefficients: [ 345.54008701 -250.14657137] Predicted y: [1422.86238865] OLS Regression Results ============================================================================== Dep. Variable: Stock_Index_Price R-squared: 0.898 Model: OLS Adj. R-squared: 0.888 Method: Least Squares F-statistic: 92.07 Date: Fri, 29 May 2020 Prob (F-statistic): 4.04e-11 Time: 08:43:16 Log-Likelihood: -134.61 No. Observations: 24 AIC: 275.2 Df Residuals: 21 BIC: 278.8 Df Model: 2 Covariance Type: nonrobust ============================================================================== coef std err t P>|t| [0.025 0.975] ------------------------------------------------------------------------------ const 1798.4040 899.248 2.000 0.059 -71.685 3668.493 x1 345.5401 111.367 3.103 0.005 113.940 577.140 x2 -250.1466 117.950 -2.121 0.046 -495.437 -4.856 ============================================================================== Omnibus: 2.691 Durbin-Watson: 0.530 Prob(Omnibus): 0.260 Jarque-Bera (JB): 1.551 Skew: -0.612 Prob(JB): 0.461 Kurtosis: 3.226 Cond. No. 394. ============================================================================== Warnings: [1] Standard Errors assume that the covariance matrix of the errors is correctly specified. ''' ##### Applying the Multiple Linear Regression (to Test Data) #from sklearn import linear_model #import statsmodels.api as sm XTEST = dftest[['x1','x2']] YTEST = dftest['y'] ### with statsmodels XTEST = sm.add_constant(XTEST) # adding a constant # # XTEST: raw test data that has const=1, x1, and x2. pd.DataFrame(data=XTEST).to_csv("XTEST.csv", header=True, index=False) #modeltest = sm.OLS(YTEST, XTEST).fit() # Test Data is not used to build a model. #predictionstest = modeltest.predict(XTEST) # Test Data is not used to build a model. predictionstest = model.predict(XTEST) # # YTESTPRED # y : raw data YTEST # y_pred : predicted data by using raw training data x1 and x2 plus intercept. YYPREDTEST = pd.concat([YTEST, predictionstest], axis=1).rename(columns={0: 'y_pred'}) pd.DataFrame(data=YYPREDTEST).to_csv("YYPREDTEST.csv", header=True, index=False) # resultstmptest = pd.concat([YYPREDTEST, XTEST], axis=1) # resultstmptest.to_csv("resultstmptest.csv", header=True, index=False) # resultsinttest = pd.Series(regr.intercept_, index=resultstmptest.index, name='coef_const') pd.DataFrame(data=resultsinttest).to_csv("resultsinttest.csv", header=True, index=False) # resultscoef1test = pd.Series(regr.coef_[0], index=resultstmptest.index, name='coef_x1') pd.DataFrame(data=resultscoef1test).to_csv("resultscoef1test.csv", header=True, index=False) # resultscoef2test = pd.Series(regr.coef_[1], index=resultstmptest.index, name='coef_x2') pd.DataFrame(data=resultscoef2test).to_csv("resultscoef2test.csv", header=True, index=False) # pd.concat([resultstmptest, resultsinttest, resultscoef1test, resultscoef2test], axis=1) RESULTSTEST = pd.concat([resultstmptest, resultsinttest, resultscoef1test, resultscoef2test], axis=1) RESULTSTEST.to_csv("RESULTSTEST.csv", header=True, index=False) ##### 3D plot ###Training Data: df (y, x1, x2) XXX = df[['x1']] YYY = df[['x2']] ZZZ = df['y'] ### Predictions (y_pred) and Training Data (y, x1, x2) ZZZPRED = YYPRED['y_pred'] ### Test Data: dftest (y, x1, x2) XXXTEST = dftest[['x1']] YYYTEST = dftest[['x2']] ZZZTEST = dftest['y'] ### Predictions (y_pred) and Test Data (y, x1, x2); Test Data is not used to build a predictive model ZZZPREDTEST = YYPREDTEST['y_pred'] ###graph sns.set_style("darkgrid") # #frames of a graph fig = plt.figure() ax = Axes3D(fig) # #axis labels ax.set_xlabel("X1") ax.set_ylabel("X2") ax.set_zlabel("Y") ###plot ##linestyle='None' means no line # # Training Data (y, x1, x2) ax.plot(XXX,YYY,ZZZ, marker="o",linestyle='None', label='Training Data (y, x1, x2)') # # Predictions (y_pred) and Training Data (x1, x2) ax.plot(XXX,YYY,ZZZPRED, marker="*", linestyle='None', label='Predictions (y_pred) and Training Data (x1, x2)') # # Test Data (y, x1, x2) ax.plot(XXXTEST,YYYTEST,ZZZTEST, marker="+", linestyle='None', label='Test Data (y, x1, x2)') # # Predictions (y_pred) and Test Data (x1, x2) ax.plot(XXXTEST,YYYTEST,ZZZPREDTEST, marker="x", linestyle='None', label='Predictions (y_pred) and Test Data (x1, x2); Test Data is not used to build a predictive model') ax.legend() ###show a prediction equation on the plot # minx = min(XXX.min()[0],XXXTEST.min()[0]) miny = min(YYY.min()[0], YYYTEST.min()[0]) minz = min(ZZZ.min(), ZZZPRED.min(), ZZZTEST.min(), ZZZPREDTEST.min()) # ax.text(minx + (abs(minx) * 0.05), miny + (abs(miny) * 0.05), minz + (abs(minz) * 0.05), 'y_pred (Training Data) = ' + str(np.round(regr.intercept_, decimals=2)) + ' + (' + str(np.round(regr.coef_[0], decimals=2)) + '* x1) + (' + str(np.round(regr.coef_[1], decimals=2)) + '* x2)', color='black') ax.text(minx, miny, minz, 'y_pred (Test Data) = ' + str(np.round(regr.intercept_, decimals=2)) + ' + (' + str(np.round(regr.coef_[0], decimals=2)) + '* x1) + (' + str(np.round(regr.coef_[1], decimals=2)) + '* x2)', color='black') plt.savefig("Figure_5_y_x1_x2_y_pred_training_data_n_predictive_model_results_and_test_data_n_model_predications.png") # added to save a figure plt.show() |
Figures
Figure_1_y_x1_training.png
Figure_2_y_x2_training.png
Figure_3_y_x1_test.png
Figure_4_y_x2_test.png
Figure_3_y_x1_x2_y_pred_training_data_n_predictive_model_results_and_test_data_n_model_predications
References
Example of Multiple Linear Regression in Python


No comments:
Post a Comment